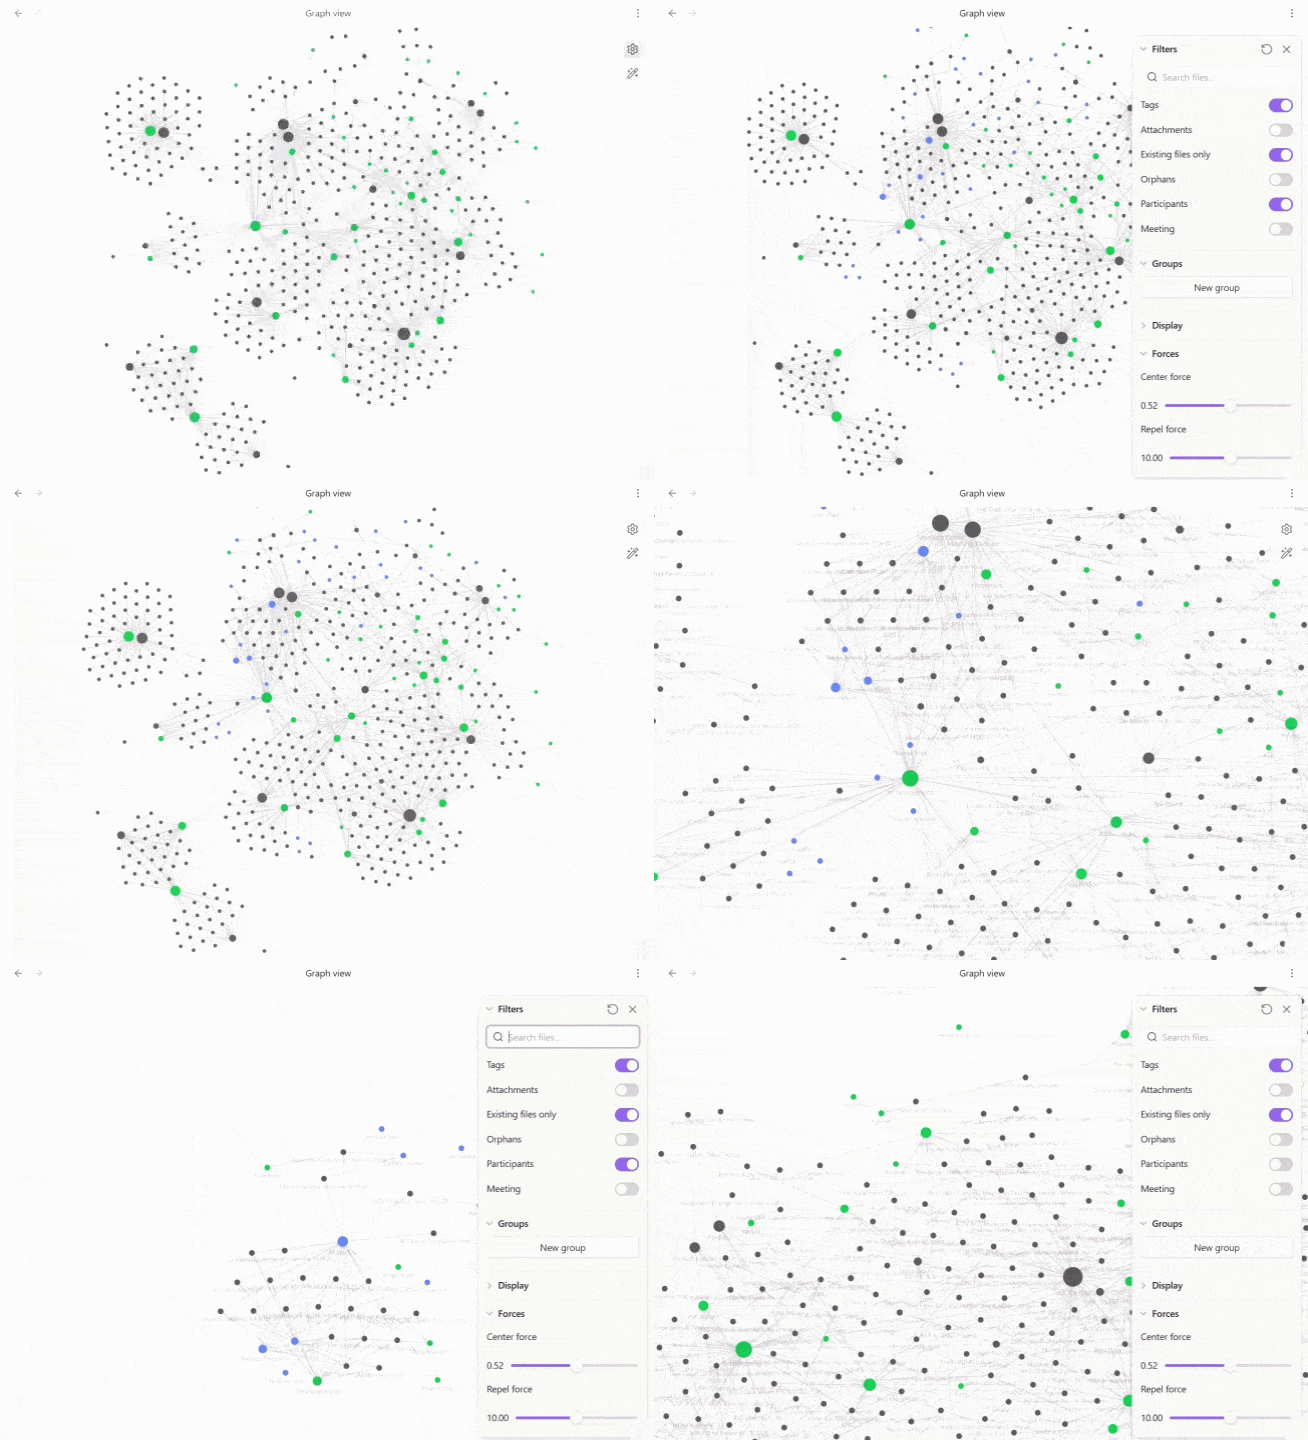
So I’ve been using Obsidian for quite some time now, at this point pretty much every day for almost everything related to my job… probably like most, have developed a very specific workflow / setup and completely built around it. A colleague of mine recently put together their own plugin, which got me thinking I wanted to join in on the fun and publish one myself - his was slightly more ambitious but I wanted to keep it simple and solve a basic feature Ive felt was missing from Obsidian for sometime.
The itch in question was that my graph view was rather limited from the standpoint I could only utilize tags and connections, whereas I personally have a large number of attributes / properties (used almost as specific tags). It was for this reason I developed this plugin that allows you to assign properties to the graph view (as if they were tags) - Properties To Graph
My vaults lean heavily on frontmatter - things like participant, status or meeting_type etc to organize notes in a way tags alone can’t. Tags to me are topics, things that run across a whole range of notes (LLMs, Machine Learning, Datamesh etc) whereas frontmatter properties are specific to that one note - participant says who was actually in the room, meeting_type says whether it was adhoc or a face to face etc. The trouble is Obsidian’s graph view has always only grouped things by tags and links, so all that structured metadata sitting in my frontmatter was essentially invisible on the graph. I wanted to be able to explore / look at the graph and also identify patterns or groups forming around a property value, the same way tags already do.
At a high level, the plugin hooks into Obsidian’s internal graph renderer and injects virtual nodes for whichever frontmatter properties you choose - each value becomes its own node, in its own color, connected to every note that shares that value:
---
department: Digital
topics:
  - Data
  - AI
---
Adding department in the settings above creates a single Digital node in that property’s color. Adding topics creates Data and AI nodes in their own color, both connected back to the note. From there it behaves just like a tag node would - if you click a node, it filters the graph down to just those notes - shift + click a node to fold its notes away, shift + click again to unfold and lastly toggle a property on / off directly from the graph’s own filters panel.
It’s built around the same graph injection approach I shamelessly borrowed from the Folders to Graph plugin. Biggest issue is that it utilities Obsidian’s internal (and undocumented) graph renderer APIs rather than the public plugin APIs - this means it’s likely a bit more fragile to future Obsidian updates than I’d like, but time will tell on this one.
I think there’s still a few minor bugs (mostly around the settings side) but it’s largely in a working condition and doing exactly what I built it for. I have no ambition to build this into anything much more - it’s solving a very specific niche point I wanted solved, and I’d rather keep it lean than scope-creep it into something it was never meant to be.
If you want to try it yourself, you can grab it via the community plugin directory or the GitHub repo here.